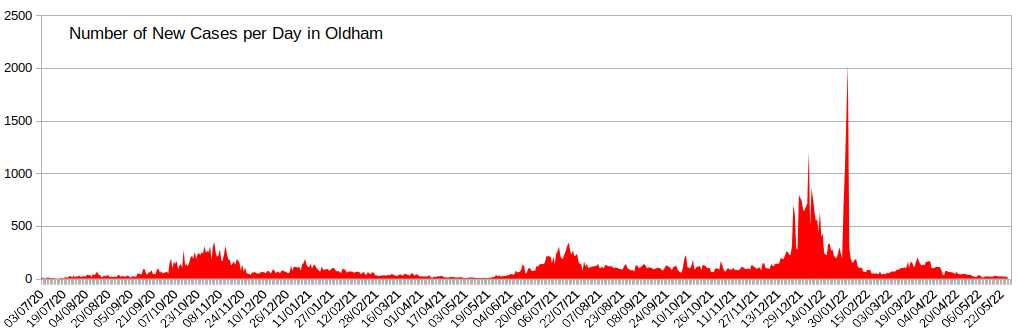
For the week ending May22
Oldham had 50 cases per 100,000 persons, the City of Manchester had 71
The national average for the period was 71
Since April 2020 Oldham has recorded a total of 79,588 cases of the Covid-19 virus to date which means that more one third of Oldham's population have tested positive since the start of the pandemic.
Sources NHS & Public Health England, ONS & BBC
The latest advice from Public Health England and the NHS regarding the COVID-19 outbreak can be found here: Current NHS Advice ►
Latest info from oldham council: https://www.oldham.gov.uk/coronavirus ►
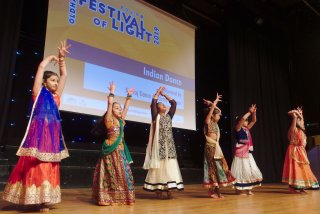
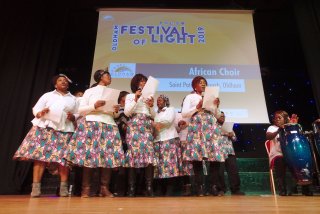
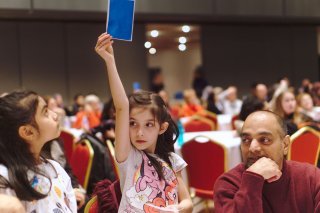
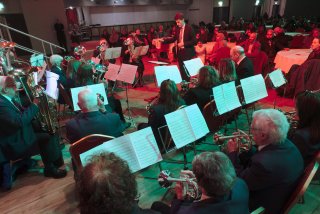
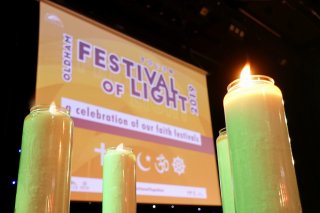 Each Year Oldham Interfaith Forum shares and celebrates four faith festivals The Christian festival of Christmas, the Judiac festival of Channukah, the Muslim festival of Mawlid-an-Nabi and Deepawali (Divali) celebrated by Hindsu, Jains, Sikhs and Buddhists.